Chapter 3: Understanding Your QPS Funnel
Audience: media buyers, campaign managers
This is the home page of Cat-Scan (/). Everything starts here.
What you see
The QPS Waste Optimizer page shows your RTB funnel (the journey from bid request to spend) and highlights where volume drops off.
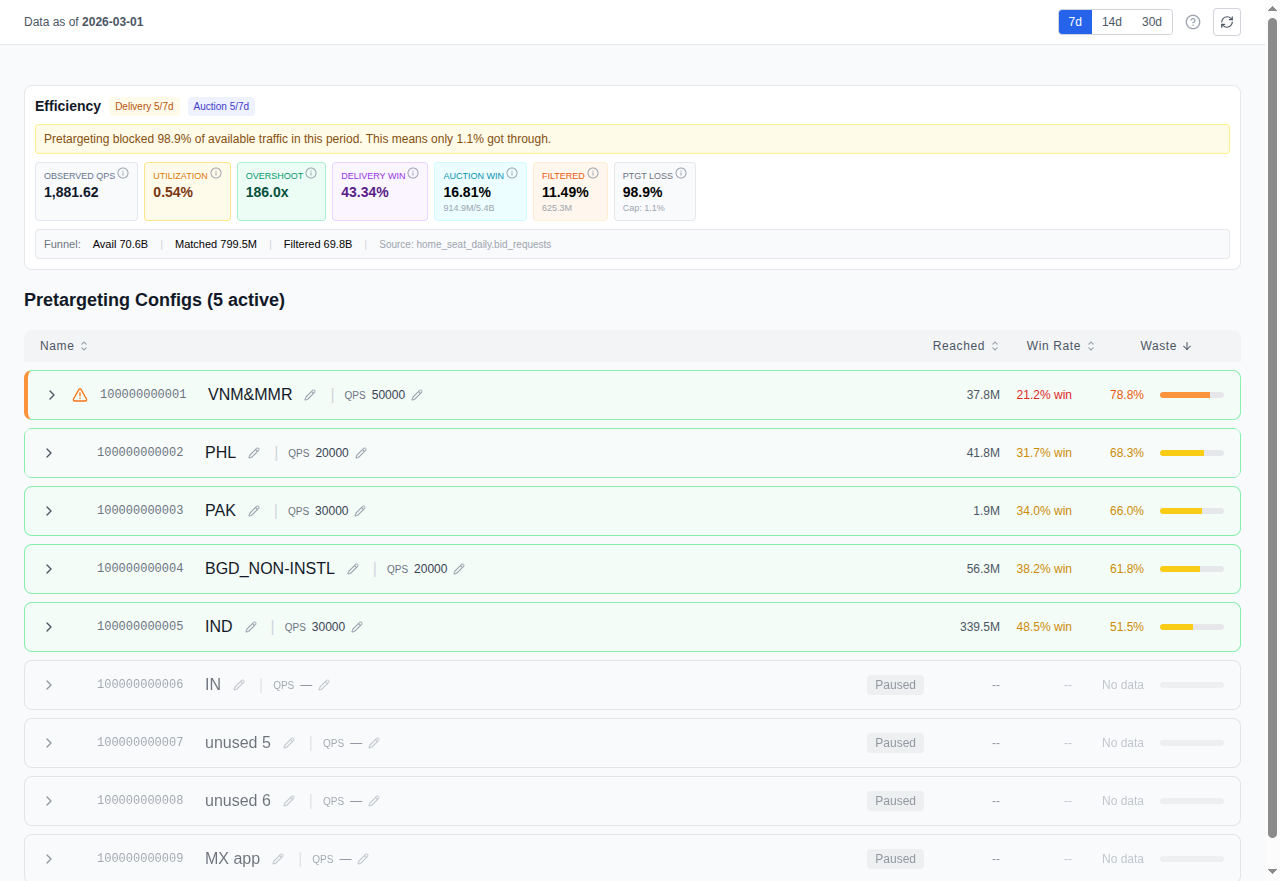
The funnel
| Stage | What it means |
|---|---|
| QPS | The maximum bid requests per second you ask Google to send. Google throttles the actual volume based on your account tier, so you typically receive less than your cap. |
| Bids | How many of those requests your bidder chose to bid on. The rest were rejected (wrong inventory, no matching creative, below floor price). |
| Wins | Auctions your bidder won. You only pay for wins. |
| Impressions | Ads actually served to users after winning. |
| Clicks | User interactions with your served ads. |
| Spend | Total money spent on won impressions. |
The gap between each stage is where optimization opportunity lives. A large drop from QPS to Bids means your bidder is rejecting most of what Google sends, classic waste that pretargeting can fix.
Key metrics
- Win rate: Wins / Bids. How competitive your bids are.
- CTR: Clicks / Impressions. How engaging your creatives are.
- CPM: Cost per thousand impressions. What you're paying for visibility.
- Waste ratio: (QPS - Bids) / QPS. The fraction of traffic you can't use.
Pretargeting config cards
Below the funnel, you'll see cards for each of your pretargeting configurations (up to 10 per seat). Each card shows:
- State: Active or Suspended
- Max QPS: The cap on bid requests this config accepts
- Formats: VIDEO, DISPLAY_IMAGE, DISPLAY_HTML, NATIVE
- Platforms: DESKTOP, MOBILE_APP, MOBILE_WEB, CONNECTED_TV
- Geos: Included and excluded geographic targets
- Sizes: Included ad sizes (or all if unfiltered)
Controls
- Period selector: 7, 14, or 30 days of data
- Seat filter: scope to a specific buyer seat
- Config toggle: drill into a specific pretargeting config
How to read it
Start with the waste ratio. If it's above 50%, you have significant room to improve. Then look at which configs contribute the most waste. Click into the dimension analyses (Geo, Publisher, Size) to find the specific sources.
Related
- Analyzing Waste by Dimension: drill into geo, publisher, and size
- Pretargeting Configuration: act on what you find